
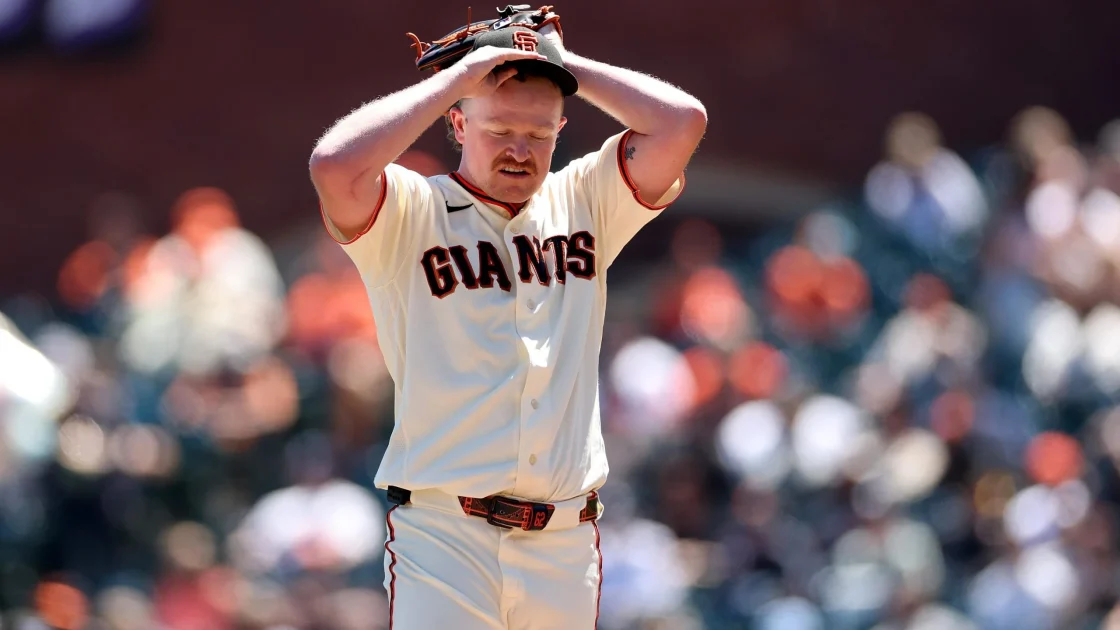
Recent salary floor and cap proposals put forward by Major League Baseball owners appear to use the San Francisco Giants as a benchmark for team competitiveness. An analysis of the proposed figures demonstrates how closely the franchise’s historical spending aligns with the financial limits under discussion.
Evolution of the Owners’ Proposals
In May, team owners pitched an initial salary floor of $171.2 million and a cap of $245.3 million, calculated using the Competitive Balance Tax (CBT) as a foundation. The proposal factored in the average annual value of contracts alongside mandatory league contributions, including an estimated $18 million per team for player health care in 2026 and a fixed annual pre-arbitration bonus pool contribution of $1.67 million.
Additionally, the formula incorporated amateur bonus pools, combining a team’s amateur draft figure with its international bonus pool. Due to draft positioning and trades, the Giants’ combined amateur pool for 2026 reached $22.79 million. When factoring in a $204.53 million roster AAV alongside health care and pre-arbitration costs, the Giants’ projected total under the May proposal reached $246.99 million—sitting roughly $10,000 below the suggested cap.
Last week, the league introduced a revised offer featuring a $1 million minimum salary, an increased floor of $180.2 million, and a cap raised to $258.2 million, alongside a 30% increase in the pre-arbitration bonus pool and a 154-game schedule.
Historical Spending and Franchise Valuations
The highest real-money expenditure for the Giants’ major league roster occurred in 2024 at $210.9 million, against a CBT figure of $251.94 million. Factoring in roster AAV, amateur pools, health care, and the pre-arbitration pool brought that season’s total to $265.81 million, which exceeds the league’s latest proposed cap.
With major league franchises valued between $3.9 billion and $4 billion, actual labor expenses represent less than 10% of business value, running at approximately 6.25%. Over the past decade, the Giants have allocated $1.94 billion to their 40-man roster, yielding an 823-857 record, four managers, four playoff wins, three top executives, two winning seasons, and an uninspired stretch of performance.
An examination of combined payroll data for all 30 MLB teams from 2016 to 2026 reveals that the top 12 teams maintained a combined win percentage of .528 with an average payroll around $172.5 million, compared to a .482 win percentage and $64.75 million average for the bottom 18 teams. The latest floor-cap proposal would reduce this historical 2.66:1 disparity down to 1.43:1.
The Giants’ average payroll since 2016 stands at $176.1 million, which projects to an inflation-adjusted value of $184.29 million by 2028, when the newest cap proposal is slated to phase in. Adding projected healthcare benefits, average amateur bonus pools, and pre-arbitration contributions brings the total to $222.29 million, representing 86% of the league’s latest cap proposal.